
The Invisible Force: How Business Cycles Affect Corporate Earnings | Quick ₹eads
- Editor

- Jan 7
- 7 min read
by Karnivesh | 7 January 2026
The Mystery Nobody Talks About
Two investors look at the same company in different years.
Investor A (2021): "Earnings grew 40% year-over-year! This company is a growth machine!"
Investor B (2023): "Same company. Earnings grew 2% year-over-year. It's a dud."
Both wrong. The company barely changed. The business cycle changed.
Corporate earnings don't move in a straight line. They move in cycles—big, violent cycles driven by the broader economy. Understanding these cycles separates investors who buy at peaks (and crash) from investors who buy at troughs (and soar).
This is the story business cycles tell. And it's far more important than most investors realize.
The Cycle: How Economies Boom and Bust
A business cycle is the alternating pattern of economic growth and contraction that every economy experiences.
The typical pattern:
Expansion Phase: GDP accelerates, consumers spend, companies invest, earnings soar.
Peak: GDP growth is strongest, but inflation rises, central banks tighten policy.
Contraction Phase: GDP slows, consumers pull back, companies cut costs, earnings collapse.
Trough: GDP growth is weakest, unemployment peaks, but valuations become cheap.
In India, we've seen multiple cycles:
FY20 (COVID Crash): GDP contracted 6.2%. Corporate earnings? Crashed 18.5%. Not proportional. Why? Because companies have fixed costs (salaries, rent, interest). When revenue drops 20%, profits drop 50%.
FY21-22 (Recovery Boom): GDP grew 8.9-8.7%. Corporate earnings surged 25.3%, then 15.8%. The rebound was violent because companies went from barely surviving to running at full capacity.
FY24-25 (Slowdown): GDP slowed from 8.2% (FY24) to 6.3% (FY25). Corporate earnings growth decelerated from 12.6% to just 2.8%. A modest GDP slowdown caused a dramatic earnings slowdown.
FY26 (Recovery Expected): GDP projected at 6.7%. Earnings growth expected to recover to 8.5%.
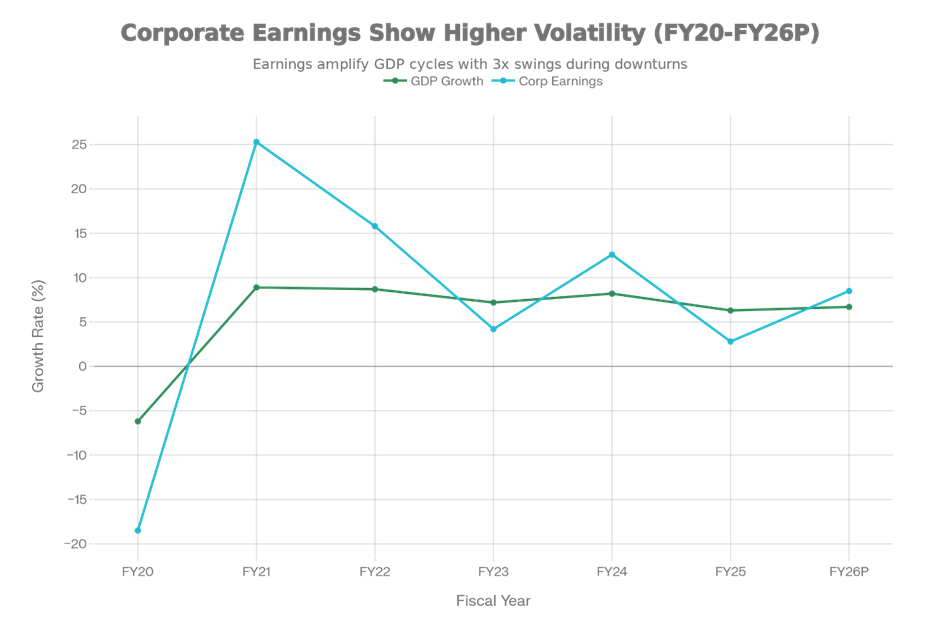
The Earnings Amplifier: How Corporate Profits Swing Far More Violently Than GDP Growth
The key insight? Earnings growth is 2-3x more volatile than GDP growth. This is the "earnings amplifier" effect, and it determines everything about valuation and stock returns.
The Banking Story: Interest Rates and Profit Margins
HDFC Bank and the Indian banking system show perfectly how business cycles destroy and create profit.
When the RBI raises interest rates (tightening cycle), banks initially suffer. Here's why:
In 2022-2024, the RBI raised the repo rate 250 basis points (from 4% to 6.5%). Bank deposits grew slower than loans because savers could earn better FD rates elsewhere. NIMs (Net Interest Margins) compressed even though rates were rising.
HDFC Bank's profit growth decelerated sharply in FY24-25 as NIMs compressed from 3.8% to 3.6%. A 20 bps (0.2%) margin decline sounds small. On a ₹15 lakh crore asset base, it's worth ₹300 Crore in annual profit.
But then the cycle reversed. In December 2025, the RBI cut rates by 25 bps to 5.25%. Market participants expect further cuts. As lending rates fall slower than deposit rates, NIMs will expand. Banks' profits will re-accelerate.
The consultant's view: "Banking earnings are the interest rate cycle. When rates are rising, banks look weak. When rates are falling, banks look strong. Neither is true. It's just the cycle."
The Auto Sector: The Cyclical Bellwether
The automotive sector is the textbook cyclical industry. It moves with the business cycle almost perfectly.
Expansion Phase (FY24–25):During FY24–25, the sector benefited from a strong macroeconomic environment. GDP growth stood at 8.2%, rural demand remained robust supported by higher agricultural incomes, and interest rates began to ease after a prolonged tightening cycle. These tailwinds translated into strong vehicle demand, with auto sales growing 11–14% across segments. Leading OEMs such as Maruti, Bajaj, and Hyundai reported strong earnings, reflecting both volume growth and operating leverage.
Slowdown Phase (FY25–26):In FY25–26, the cycle entered a slowdown phase as GDP growth moderated to 6.3–6.7%. Urban middle-class consumers turned cautious due to rising ownership costs and sticky inflation. Demand weakened most sharply in two-wheelers and entry-level passenger cars, which are highly sensitive to affordability. As a result, industry growth for FY26 is expected to slow to just 1–2%, with earnings growth decelerating sharply across the sector.
But here’s the cycle turning again:Several early indicators now point toward a recovery. Interest rates have begun easing, with the repo rate cut by 25 basis points and further reductions expected, which will lower vehicle loan EMIs and stimulate demand. Rural recovery is gaining momentum, supported by lower food inflation, strong government support, and improving real wages. The government has also reduced GST on automobiles to boost demand, while festive-season momentum in the second half of FY26 is already showing signs of a sales recovery.
By FY27, auto sector earnings are expected to re-accelerate. Investors who accumulate auto stocks during the slowdown phase in Q3 FY26 will be positioned ahead of the recovery as the cycle turns in FY27. This represents a classic cyclical opportunity—one that most investors miss because they tend to extrapolate recent trends instead of anticipating the next turn in the cycle.
The Trap: Why Investors Buy Peaks and Sell Troughs
Here’s why business cycles systematically destroy investor returns.
Investor Behavior:During the expansion phase, corporate earnings typically grow strongly for two to three years, creating confidence across markets. Analyst reports begin reinforcing this optimism, often declaring that “this time is different” and that higher growth is the new normal. As narratives strengthen, investors rush in, pushing valuations to all-time highs. Eventually, earnings growth slows as the cycle turns into contraction. This sudden slowdown triggers panic, leading investors to sell—often at losses. Ironically, when earnings recover a few years later, most investors have already exited and miss the recovery phase entirely.
Example: India’s Growth in FY24–25:In FY24, India recorded strong GDP growth of 8.2%, with corporate earnings rising by 12.6%. The prevailing consensus was that India had decoupled from global economic cycles and could sustain 10%+ earnings growth for years. This optimism pushed valuations sharply higher, with the Nifty 50 P/E crossing 24x—an all-time high. However, the reality in FY25 was starkly different. GDP growth slowed to 6.3%, and earnings growth collapsed to just 2.8%. Investors who bought aggressively in FY24 under the belief of a “new normal” ended up losing 15–20% during 2025.
The investors who ultimately succeeded were those who understood the cyclical nature of the economy. They bought during FY26, when growth had slowed and valuations had compressed, anticipating the next recovery rather than reacting to the last boom.
The Monetary Policy Weapon: How Central Banks Steer Cycles
The RBI does not fight business cycles directly; instead, it amplifies or dampens them through interest rate policy.
During the boom (FY22–24):In the expansionary phase between FY22 and FY24, the RBI raised interest rates by a cumulative 250 basis points to control rising inflation. This tightening slowed an economy that was beginning to overheat. As borrowing costs increased and liquidity tightened, corporate earnings growth moderated, falling from above 15% to a more sustainable 8–10% range.
During the slowdown (FY25–26):As growth weakened in FY25–26, the RBI shifted its stance and began cutting rates, including a 25 basis point cut in December 2025, with further reductions expected. Lower interest rates are designed to stimulate borrowing, investment, and consumption. This easing cycle typically sets the stage for corporate earnings to re-accelerate after a period of slowdown.
What cycle-aware investors could anticipate:Investors who understood the interest rate cycle could have anticipated that FY24’s strong earnings growth would naturally decelerate in FY25 while the RBI was still in tightening mode. Equally, they could have predicted that FY26 earnings growth would begin turning positive as the RBI moved toward easing—a trend that is now playing out.
The Three Cycle Phases and Earnings Implications
Phase 1: Early Expansion (GDP accelerating from 5% to 8%)During early expansion, earnings growth is typically strong, often exceeding 15% annually. Companies operate at high capacity utilization, enjoy strong pricing power, and benefit from healthy consumer demand. However, valuations are often elevated in this phase, as investors extrapolate strong growth into the future, leading to P/E multiple expansion.
Phase 2: Late Expansion → Peak (GDP at 8%+, inflation rising)In the late expansion or peak phase, earnings growth begins to decelerate, typically falling from around 15% to closer to 8%. This slowdown occurs as the RBI tightens monetary policy, input costs rise, and demand shows early signs of weakening. Valuations are usually at their most expensive during this phase, as analyst upgrades continue even while underlying cracks emerge. Risk is at its highest, as investor optimism peaks precisely when downside risk is greatest.
Phase 3: Contraction (GDP slowing, RBI cutting rates)During contraction, earnings growth often turns negative or remains in low single digits. Weak demand forces companies to cut costs, and pricing power largely disappears. Valuations, however, become the cheapest relative to normalized earnings. This phase offers the maximum opportunity for long-term investors, even though sentiment is typically at its most bearish—highlighting the classic mismatch between perception and opportunity in market cycles.
The Scorecard
When analyzing how business cycles will affect earnings, ask:
Where in the cycle is the economy? Accelerating GDP? Peak? Decelerating? Each phase has different implications.
Where are interest rates? Rising rates slow earnings growth. Falling rates accelerate it.
Is the current P/E valuation justified by the cycle position? If GDP is at peak and valuations are 24x, danger. If GDP is at trough and valuations are 12x, opportunity.
Which sectors benefit from THIS cycle stage? During rate cuts, banks suffer initially (NIM compression), then win. During rate hikes, industrial businesses suffer.
How much earnings growth is "cycle" vs. "structural"? Maruti growing 10% because auto demand is cyclically recovering is different from Maruti growing 10% because it's gaining market share (structural).
The Final Truth
Corporate earnings don't move in straight lines. They move in cycles—violent, predictable cycles driven by the business cycle, interest rates, and consumer demand.
The investors who win understand these cycles and profit from them:
Buy when the economy is slowest and earnings are weakest (cycle trough)
Sell when the economy is strongest and earnings are strongest (cycle peak)
The investors who lose do the opposite—buying at peaks extrapolating good times forever, and selling at troughs convinced the world is ending.
Business cycles are not risks to fear. They're opportunities to exploit. The trick is recognizing where you are in the cycle—and having the discipline to act when everybody else is panicked.


Comments