
How Data Analytics Helps Brokers Predict Market Trends
- Editor

- Oct 24, 2025
- 5 min read
by KarNivesh | 24 October, 2025
In today’s fast-moving financial markets, brokers face the tough challenge of predicting price movements quickly and accurately. The ability to identify opportunities, forecast market trends, and manage risks effectively has become essential. This is where data analytics has completely changed how brokers work.
By using technologies like Artificial Intelligence (AI), Machine Learning (ML), Sentiment Analysis, and Big Data, brokers can now study vast amounts of information in seconds. This helps them make faster and more accurate decisions that were impossible with traditional methods.
What is Data Analytics and Why It Matters to Brokers
Data analytics is the process of collecting, cleaning, and analyzing data to draw meaningful conclusions. For brokers, it helps convert massive amounts of market data—such as price history, trading volume, financial reports, and even social media posts—into useful insights.
The global data broker market, valued at around ₹23,163 crore (USD 2.77 billion) in 2024, is expected to grow to ₹42,720 crore (USD 5.12 billion) by 2033, with a 7.3% annual growth rate. This shows how important data-driven decision-making has become for financial services.
Brokers now depend on algorithms and models that can turn raw data into clear trading signals. This allows them to make informed choices in trading, risk control, and client management.

How Brokers Use Data Analytics
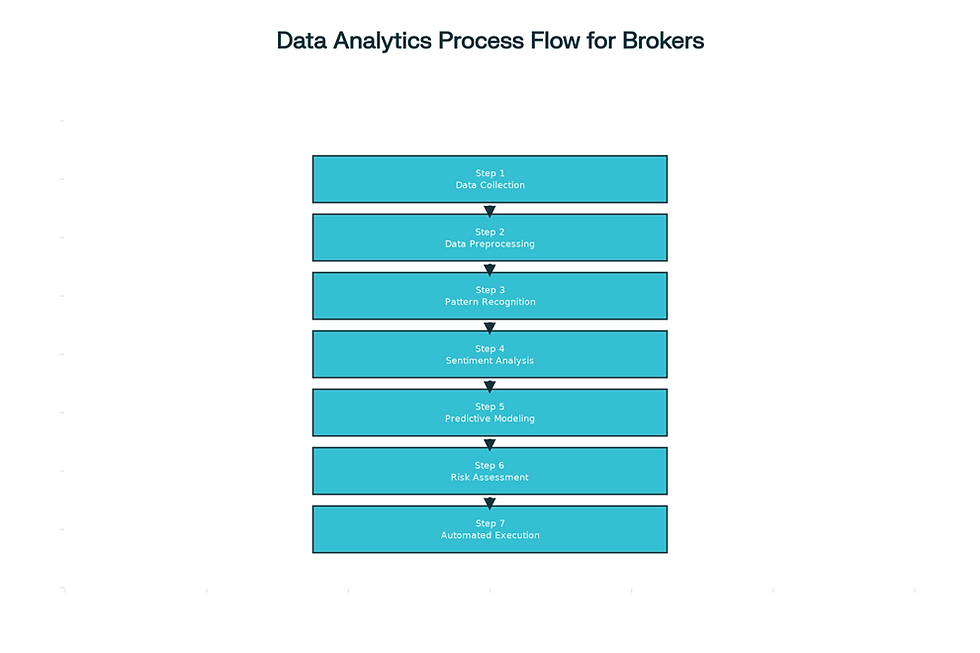
Data analytics in brokerage involves collecting both structured data (like prices and volumes) and unstructured data (like news and social media). These data sources are analyzed to find patterns that might affect the market.
For example:
Oil price changes may affect airline stock prices.
Social media mood before an earnings report can predict how a stock might move after the report.
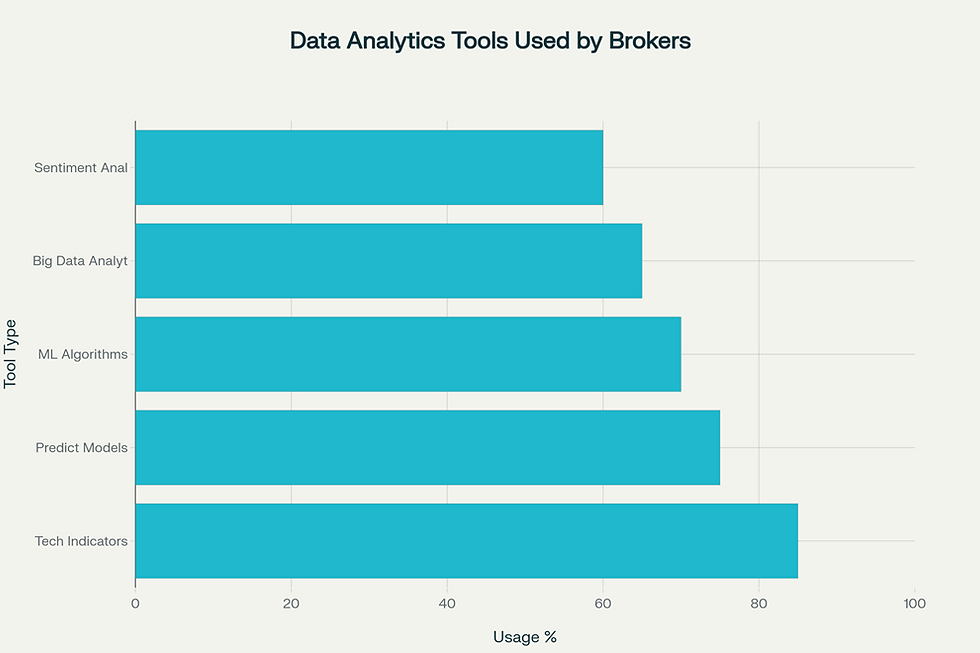
Surveys show that around 85% of brokers use technical indicators, 75% use predictive models, 70% use ML algorithms, and 60% rely on sentiment analysis.
Earlier, brokers mainly depended on fundamental and technical analysis. Now, they use advanced, automated systems that can process millions of data points in real time. Cloud platforms like AWS Data Exchange and Microsoft Azure Data Share have made data access faster and easier.
Key Data Sources Used by Brokers
Brokers use multiple types of data to predict trends:
Historical price data helps understand past behavior to forecast future movements.
Real-time market data provides updates every millisecond, crucial for high-frequency trading.
Trading volume data shows how strong or weak a price movement is.
Apart from these, brokers are now using alternative data such as:
Social media sentiment, which can improve prediction accuracy by 8–12%.
News and articles, analyzed using Natural Language Processing (NLP) to extract real-time sentiment.
Economic indicators like GDP, inflation, and employment figures.
Even satellite images, shipping records, and weather data are becoming useful tools for predicting market changes.
Role of Machine Learning and Artificial Intelligence
Machine learning helps computers learn from past market data and make predictions without needing to be explicitly programmed for every situation.
For instance:
LSTM networks (a type of deep learning model) can predict stock prices with 91.5% accuracy.
Random Forest models achieve around 80% accuracy in predicting market direction.
CNN models, originally for image recognition, now help detect chart patterns with 5–10% better accuracy.
AI also supports automated trading. Reinforcement learning models power trading systems that operate independently, like Tech Trader, which has been active since 2012.
Today, around 70% of U.S. equity trades are executed by AI-powered systems, showing how much the technology dominates modern trading.
Predictive Analytics and Sentiment Analysis
Predictive analytics uses historical data to forecast future prices. A common model used is ARIMA, which has an accuracy rate between 72% and 78%.
However, combining analytics with sentiment analysis greatly improves results. By studying social media, news, and reports, models can understand investor emotions—whether the market is feeling bullish or bearish.
For example:
When Twitter sentiment is analyzed alongside price data, prediction accuracy can reach 85%.
Excluding sentiment data reduces accuracy by up to 12%.
Hybrid models that mix technical, fundamental, and sentiment analysis give the most reliable results. Brokers also use backtesting to check how these models perform with past data before using them in live markets.

Real-Time Data and High-Frequency Trading
Real-time data is a game-changer for brokers. Advanced systems now process millions of price updates every second, helping traders react instantly.
High-frequency trading (HFT) depends on this data, using algorithms to spot and act on opportunities lasting only milliseconds.
Companies like the London Stock Exchange Group (LSEG) handle over 9 million price updates per second and process 2.5 terabytes of data daily. This massive data helps brokers track momentum, volatility, and liquidity in real-time.
Technical Indicators and Trading Signals
Brokers rely on technical indicators—mathematical formulas that simplify complex market data into clear signals.
Trend indicators like Moving Averages and MACD help identify market direction.
Momentum indicators like RSI and Stochastic Oscillators show whether assets are overbought or oversold.
Volatility indicators like Bollinger Bands and ATR measure price fluctuation risks.
Volume indicators like OBV and VWAP confirm how strong a price move really is.
Decision tree algorithms that combine these indicators achieve 77–85% accuracy in predicting stock movements. Automated trading systems use such indicators to execute trades automatically, removing emotional bias and improving consistency.
Data Analytics in Risk Management
Managing risk is one of the most important uses of data analytics.
Machine learning models detect early warning signs of market crashes.
Anomaly detection identifies suspicious or unusual trading behavior.
Real-time monitoring tracks exposure, volatility, and compliance with regulations.
Predictive risk analytics can foresee volatility before it hits. Portfolio optimization tools help balance risk and return, while automated systems rebalance investments based on changing market conditions.
Studies show data analytics can reduce risk exposure by 40–60% through early detection and preventive actions.
The Future of Data Analytics in Brokerage
The next phase of data analytics will combine AI, quantum computing, and decentralized finance (DeFi).
Quantum computing will allow calculations thousands of times faster than current systems, revolutionizing portfolio management and options pricing.
DeFi analytics tools will monitor blockchain-based markets, offering new transparency but also new risks.
AI-powered robo-advisors will deliver personalized, low-cost financial advice.
Explainable AI will make algorithms more transparent and easier for regulators to understand.
As technology advances, ethical issues like data privacy, market manipulation, and algorithmic bias will become more important.
Regulations such as GDPR will ensure client data is handled responsibly. Brokers who manage these challenges while maintaining human oversight will stay ahead in a highly competitive, automated financial world.
Conclusion
Data analytics has completely reshaped how brokers predict and trade in financial markets. It allows them to move beyond guesswork, using real-time insights and predictive models to make smarter, faster, and safer decisions.
Modern brokers who use machine learning, sentiment analysis, and AI can achieve up to 92% accuracy in market forecasts. They also experience up to 60% less risk, 50% lower costs, and nearly instant decision-making.
The future of trading belongs to those who can best use data—not just to react to markets, but to predict and lead them.


Comments