
Gland Pharma Limited: Comprehensive Stock Analysis Report | Scrolls
- Editor

- Oct 3
- 2 min read
by KarNivesh | 03 October, 2025
Gland Pharma Limited, established in 1978 and headquartered in Hyderabad, is one of India’s leading manufacturers of complex injectables. Operating primarily under a B2B model, the company has built strong market presence in regulated geographies such as the US, Europe, and other regions. Recent growth has been supported by the acquisition of Cenexi in Europe, which strengthened its CDMO (contract development and manufacturing) capabilities. In Q1 FY26, the company reported revenues of ₹15,056 million, marking a 7% year-on-year growth, while net profit surged 50% due to operational efficiencies and Cenexi’s turnaround.
Industry and Competitive Position
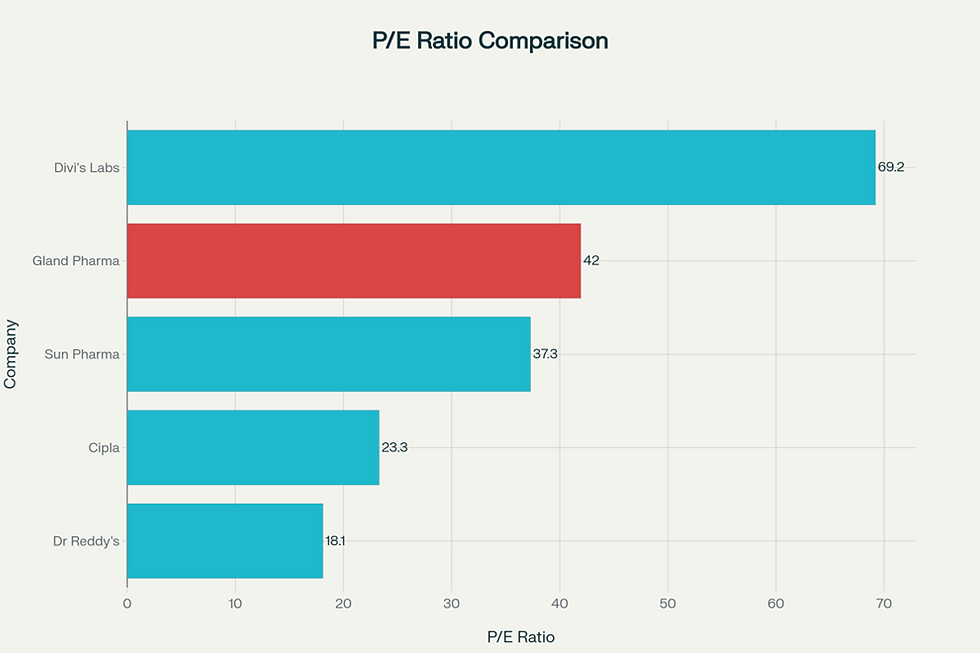
The Indian pharmaceutical sector continues to expand, backed by policy incentives like the PLI scheme, liberalized FDI rules, and rising global demand for specialty generics and biosimilars. However, risks such as regulatory scrutiny, US tariff threats, and global competition remain. Within the industry, Gland Pharma competes with established players like Sun Pharma, Dr. Reddy’s, Cipla, and Divi’s Labs. While it has strengths in sterile injectable manufacturing and compliance, its profitability and return ratios lag behind larger peers.
As of September 2025, Gland Pharma’s market capitalization stood at ₹32,261 crore with a P/E ratio of 41.95, P/B of 3.55, ROE of 7.82%, and net margin of 12.44%. Comparatively, peers such as Sun Pharma and Dr. Reddy’s deliver higher returns, though Gland maintains an edge in niche injectable expertise.
Financial Performance
For the trailing twelve months (TTM), Gland Pharma posted revenues of ₹5,720 crore and a net profit of ₹770 crore, with an EPS of ₹46.75. Its ROE declined to 7.82%, while ROCE stood at 11.9%. The company maintains EBITDA margins of ~24% and net margins of 12.44%. Notably, the company is virtually debt-free with a debt-to-equity ratio of just 0.03, backed by healthy liquidity and strong cash flows. The board declared a dividend of ₹18 per share in 2025, translating to a yield of 0.92%.
Business Model and Portfolio
Gland Pharma’s portfolio covers a wide range of complex injectables across therapeutic segments including anti-malarials, oncology, anti-infectives, blood-related products, and peptides. The company manufactures in diverse formats like vials, prefilled syringes, ampoules, lyophilized vials, and bags. Its CDMO services provide end-to-end development and manufacturing for global partners. The regulatory footprint is extensive, with more than 1,700 product registrations across 60+ countries, supported by four formulation and three API facilities.
Shareholding & Governance
Promoters (Shanghai Fosun Pharma) hold 51.83% of equity, while mutual funds and FIIs own 30.67% and 7.39% respectively. Retail investors account for 7.93%. Governance remains strong with a professional board, consistent compliance with USFDA inspections, and proactive investor relations.
Conclusion
Gland Pharma stands out as a niche leader in sterile injectables with strong compliance, global expansion plans, and an almost debt-free balance sheet. However, relatively weaker profitability metrics, high US exposure, and regulatory risks demand cautious optimism. Investors should monitor margin recovery and global diversification to assess its long-term potential.


Comments